EASY-TO-READ RESULTS + REPORTS
Dynamic Patient Results and Treatment-outcome reports
Our proprietary reporting software utilizes dynamic, clinically-supported laboratory results to produce our exclusive reports.
Both reports are backed by a set of clinically-validated references generated to support each unique patient case with utmost clinical relevance.
We offer different report for Substance Use Disorder Treatment and Pain Management.

THE TYPES OF REPORTS THAT WE PROVIDE:
PATIENT RESULT REPORTS
TREATMENT OUTCOME REPORTS
PATIENT RESULT REPORTS:
DYNAMIC RESULT REPORTS CATERING TO YOUR SPECIFIC NEEDS
CARD® – COMPREHENSIVE ANALYSIS OF REPORTED DRUGS
For substance use disorder treatment
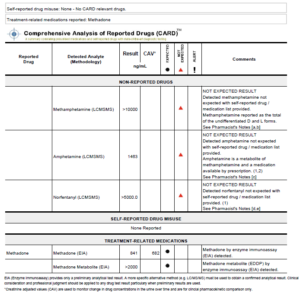
For the treatment of Substance Use Disorder, results are reported through Comprehensive Analysis of Reported Drugs (CARD®)
CARD® aids clinicians in assessment and monitoring of drug use/abstinence upon intake, throughout the course of treatment, and in aftercare monitoring.
CARD® offers patient-specific correlation between treatment-related medications and self-reported drug use with laboratory results.
SAMM® – SCIENTIFICALLY ACCURATE MEDICATION MONITORING
FOR PAIN MANAGEMENT
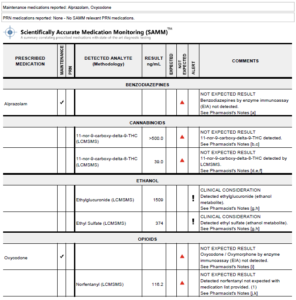
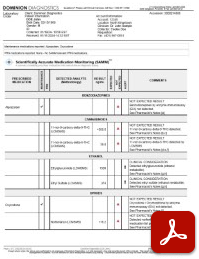
For Pain Management, results are reported through our proprietary Scientifically Accurate Medication Monitoring (SAMM)® Reports.
SAMM® allows practitioners to better monitor a patient’s prescription or drug usage for a more accurate assessment of treatment progress and prescription adherence.
SAMM® offers patient-specific correlation between prescribed maintenance and PRN (take as needed) medications with laboratory results.
OUR RESULT REPORTS HELP YOU TO:


DID YOU KNOW?
OUR PROPRIETARY CARD® RESULT REPORT
(USED FOR SUBSTANCE USE DISORDER TREATMENT) SHOWED
IMPROVED OUTCOMES
Read the study by clicking here
DYNAMIC PRACTICE REPORTING TOOLS:
TREATMENT OUTCOME REPORTS...
CLINICAL INSIGHT AND ACTIONABLE TREND DATA
- Quickly identify patients in crisis
- Monitor medication adherence and treatment compliance at the program level.
- Identify patients at risk for nonadherence or diversion
- Understand the common drug classes and medications triggering "Not Expected" results
- Identify illicit substances and unprescribed medications detected
- Identify prescribed medications not detected, increasing overall nonadherence rates
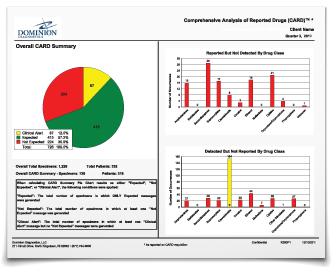
PRACTICE-WIDE AGGREGATE DATA
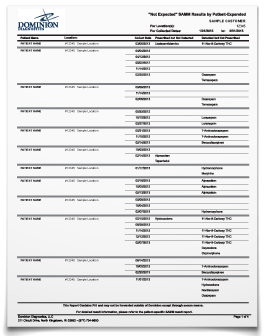
IDENTIFY PATIENTS IN CRISIS
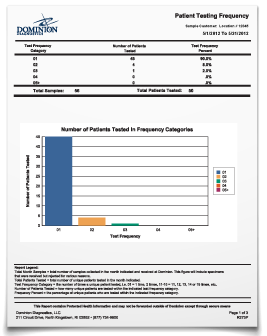
MONITOR FREQUENCY PROTOCOLS
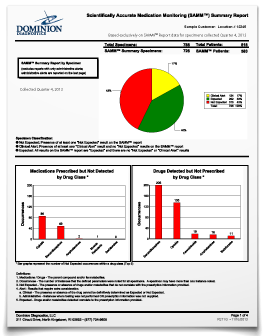
POSITIVITY RATES AND MONITOR FOR TRENDS
LEARN WITH US...
//LEARN MORE
WHAT IS ELIMINATION MONITORING?
Factors that must be considered in the interpretation of drug concentration in urine include individual differences in the rates of metabolism, absorption, distribution, urine pH, dosage intervals, dosage strength, timing of the administration of the drug in reference to the urine collection, and chronic use versus a single dose.
Because these factors complicate interpretation, no conclusions can be drawn from the concentration of the drug in the urine as to the amount of drug administered, the time since the last dose, or the degree of impairment.
However, by utilizing creatinine adjusted values one can monitor changes in drug concentrations in the urine over time. Clinicians may find these values useful with certain drugs during clinical monitoring when tracking a patient’s drug elimination is desired (Creatinine Adjusted Values).
ELIMINATION MONITORING
CREATININE ADJUSTMENT FOR ACCURATE RESULTS INTERPRETATION
Creatinine is a product of muscle contraction. Because it is produced from within and released into body fluids at a relatively constant rate, the level of creatinine in urine may be used as an indication of body hydration. Since measured drug levels can fluctuate with the level of creatinine, a key aspect of your laboratory testing is creatinine adjustment. With creatinine adjusted drug levels, you can better monitor drug usage and redefine program goals to increase treatment effectiveness.
Case Study
John, 32, was admitted to ABC Rehab for inpatient treatment for his chronic marijuana addiction. Upon intake, his clinician ordered a urine drug test to establish a baseline from which John’s treatment planning could begin. After reviewing the initial results, the clinician determined a random frequency of monitoring would be best in John’s case. John was again tested on the third, sixth, and tenth days post admission.
SCENARIO A:
No Creatinine Adjustment
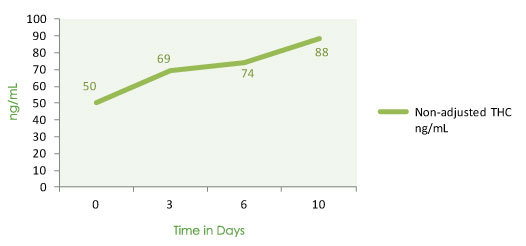
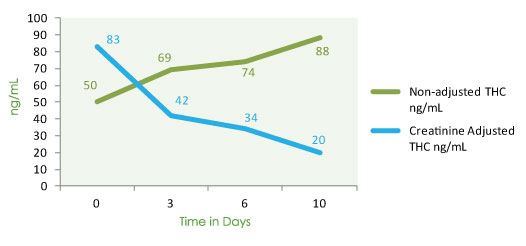
When plotted, John’s test results illustrate a steady increase over time, indicating what looks to be continuous marijuana usage. When the clinician approaches John about usage, John gets very defensive and insists he is abstaining.
SCENARIO B:
Creatinine Adjustment
John’s urine creatinine levels indicate subsequently more concentrated urines on the third, sixth, and tenth days post admission. John’s creatinine-adjusted THC test results show a steady decrease in THC levels, indicating a gradual elimination of cannabinoids over time (see chart below). When the clinician reviews the test results with John to show his THC levels are decreasing over time, there is an immediate sense of reassurance that John’s treatment is effective thus far. In the coming weeks, John shows increased involvement in his treatment program.
Calculating for Confidence: Applying the adjustment formula in John’s case
John on admittance has a measured value for THC = 50 ng/mL. John’s measured Creatinine level = 60.2 mg/dL. When applying the creatinine adjustment formula, the creatinine adjusted THC value is 83 ng/mL (50 ng/mL x 100 mg/dL ÷ 60.2 mg/dL = 83 ng/mL). On the third, sixth and tenth days post admission, John’s directly measured THC levels are 69, 74, and 88 ng/mL respectively in the urine and John’s creatinine levels are 164, 220 and 440 mg/dL, subsequently more concentrated urines. When the calculations are performed, the creatinine adjusted levels of THC are 42, 34 and 20 ng/mL respectively. The creatinine adjusted values indicate gradual elimination of cannabinoids.
Creatinine adjusted values are for clinical pharmacokinetic comparison only; these values are not intended for forensic or punitive use.
Reference: Fraser AD, Worth D. Urinary excretion profiles of 11-nor-9-carboxy-Delta9-tetrahydrocannabinol: a Delta9-THC-COOH to creatinine ratio study #2. Forensic Sci Int. 2003 Apr 23;133(1-2):26-31.

