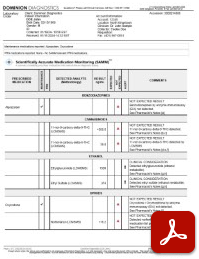
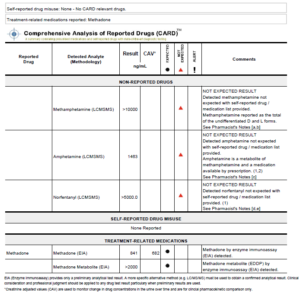
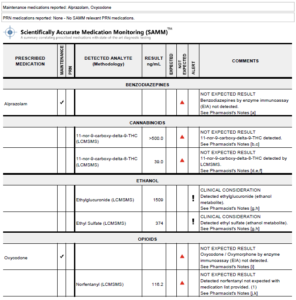
Quickly assess Expected and Not Expected testing results with visual flags

Understand the potential sources of detected drugs/metabolites
Quickly identify if a patient's self-reported misuse matches detected drug results

Accurately identify a patient’s PRN medications and identify cases for reduced medication usage
Support interpretation with scientifically validated and published medical literature
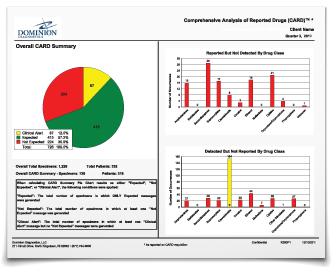
PRACTICE-WIDE AGGREGATE DATA
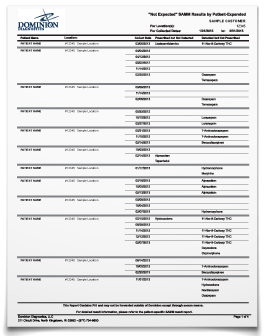
IDENTIFY PATIENTS IN CRISIS
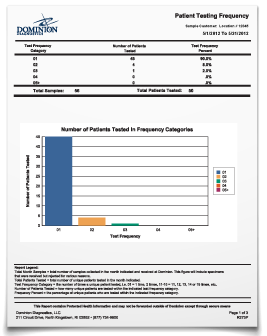
MONITOR FREQUENCY PROTOCOLS
POSITIVITY RATES AND MONITOR FOR TRENDS